MCP connectivity · live
Connect Claude Desktop, Cursor and compatible MCP assistants with OAuth sign-in to find tickers and retrieve Stock Intelix forecasts. Client compatibility and organisation plan limits apply.
Stock Intelix · AI stock research & market analysis
Statistical market analytics, on-demand stock quotes and grounded Research AI across 34 active exchanges, with live REST API and MCP access for apps and AI agents. Every output carries its own uncertainty band, driver attribution and out-of-sample track record.
Sample US technology stock
NASDAQ · 20-day outlook
228.40 USD
Upside probability 54%
Sample numbers for illustration only — not live prices or a forecast. Sign in to see real model output.
Built on public and licensed data sources
Research workspace · REST API & MCP officially live for organisation plans
REST API & MCP · Officially live
Live REST forecasts and a Model Context Protocol (MCP) server bring quantitative market research into your applications, Claude Desktop, Cursor and compatible MCP assistants.
Forecast ranges, probabilities and evidence in the Stock Intelix workspace.
Find a ticker and retrieve forecast ranges, direction probabilities and model provenance with an organisation API key.
Connect compatible assistants with OAuth sign-in. REST and MCP share one monthly organisation allowance.
Available on Org Starter and Org Pro, subject to plan limits and client compatibility. Informational only; no investment advice or guaranteed outcomes.
The platform is built around one principle: an unexplained number is worthless. Everything you see can be traced back to the features, models and history behind it.
Connect Claude Desktop, Cursor and compatible MCP assistants with OAuth sign-in to find tickers and retrieve Stock Intelix forecasts. Client compatibility and organisation plan limits apply.
Find tickers and retrieve probabilistic forecasts with an organisation API key. REST and MCP share 2,500 calls/month on Org Starter or 10,000 on Org Pro.
Every security returns a full return distribution — 5th to 95th percentile bands, median estimate, and a calibrated upside probability instead of a single-point estimate.
Trend, drawdown, consolidation and volatility-stress regimes are classified from leakage-safe features computed strictly point-in-time.
Trend-following, momentum, mean-reversion and volatility-carry models are shown side by side, with their disagreement folded into the confidence score.
34 active exchanges including Nasdaq, NYSE, DFM, Tadawul, NSE, BSE, LSE, Xetra, TSE, HKEX, SGX and ASX in one cross-market board.
Keep your selected stock’s latest available price and model probability in view. Open the side panel for day high, low, volume and forecast ranges. Quotes may be delayed; unavailable quotes fall back to a labelled stored close.
An analyst assistant that only reasons over the quantitative context of the security you are viewing — no invented prices or filings.
Directional accuracy, 90% interval coverage, bias and Brier score computed out-of-sample before you trust a number.
The same terminal serves very different desks. These are the ways customers put it to work — every use case runs on the same measured, fully attributed evidence.
You follow a handful of names and want to know when the underlying evidence actually changes. Keep a watchlist, set price and probability alerts, and review the quantile range alongside your own research — so analysis is never based on a single-point estimate.
Build coverage notes that hold up. Every projection ships with ranked drivers, the regime it assumes, fundamentals periods, macro context and the model version behind it — all traceable, nothing invented.
Aggregate the board by exchange to read breadth, volatility and upside probability at a glance, then push the base case through return shocks and volatility multipliers in the Scenario Lab as part of risk research.
Work across 34 active exchanges — from Nasdaq and LSE to NSE, DFM, Tadawul and ASX — with session status, data-level disclosure and stored coverage shown per market, so you always know how strong the evidence is.
Inspect the machine, not just the output. Walk-forward folds, ensemble weights and disagreement, historical analogs and predicted-versus-realised samples are all on the record — the same validation discipline used before any model is deployed.
Run a shared workspace with role-controlled access — owners, admins, members and analysts — while model governance keeps every forecast pinned to an immutable, versioned model with a full audit trail.
Stock Intelix is an informational research tool. It does not provide investment advice or recommendations, and nothing on this page is a solicitation to trade.
Screens from the live terminal — market overview, security research, scenario stress testing and global coverage.
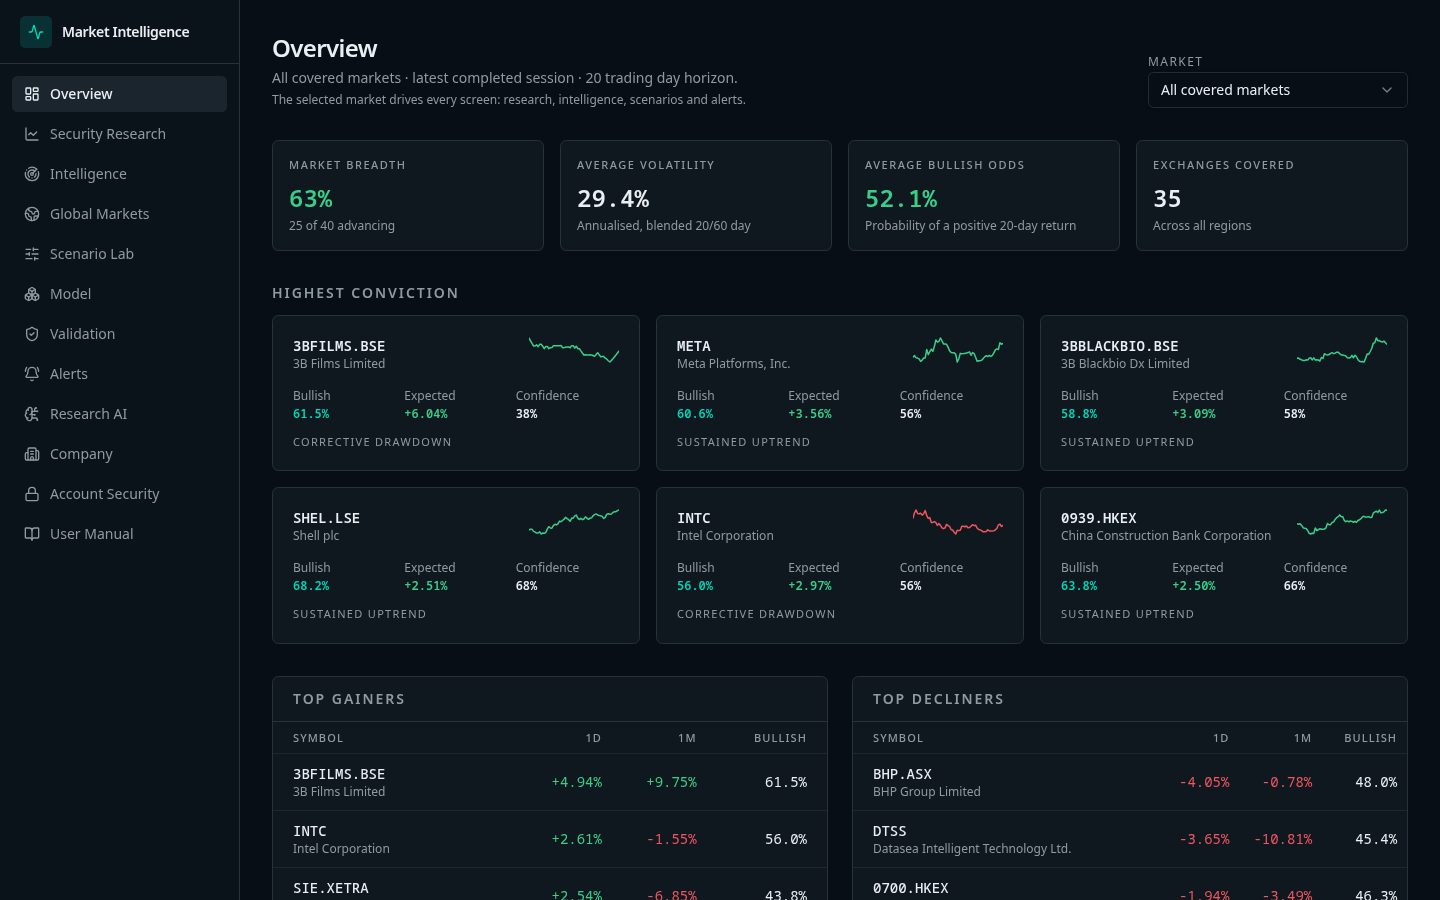
Breadth, volatility and upside probability for the market you select, summarised as research statistics.
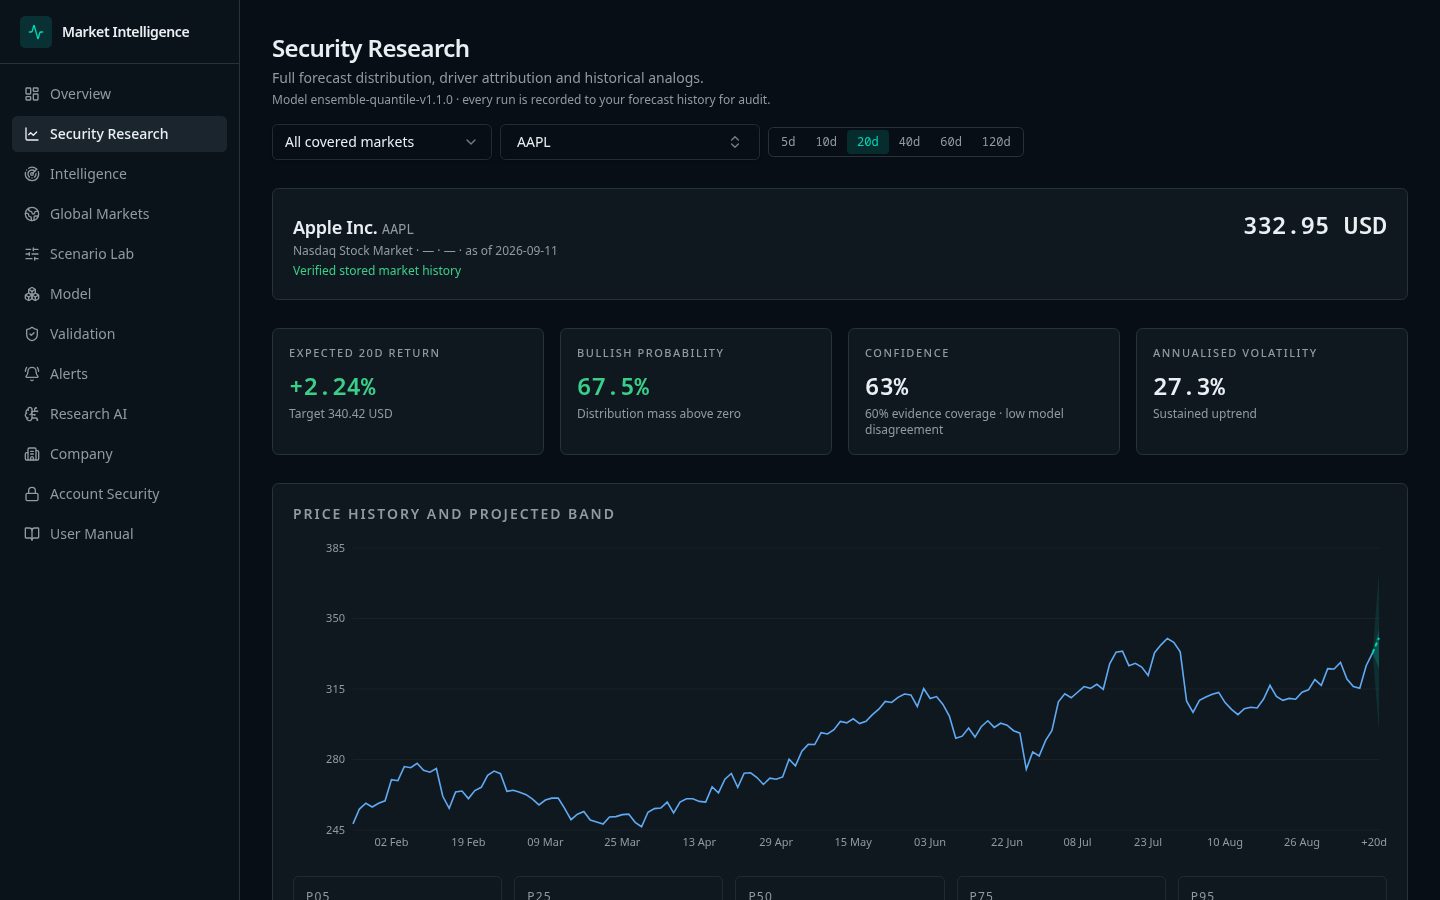
A full return distribution, ranked drivers and the evidence behind every projection for any covered company.
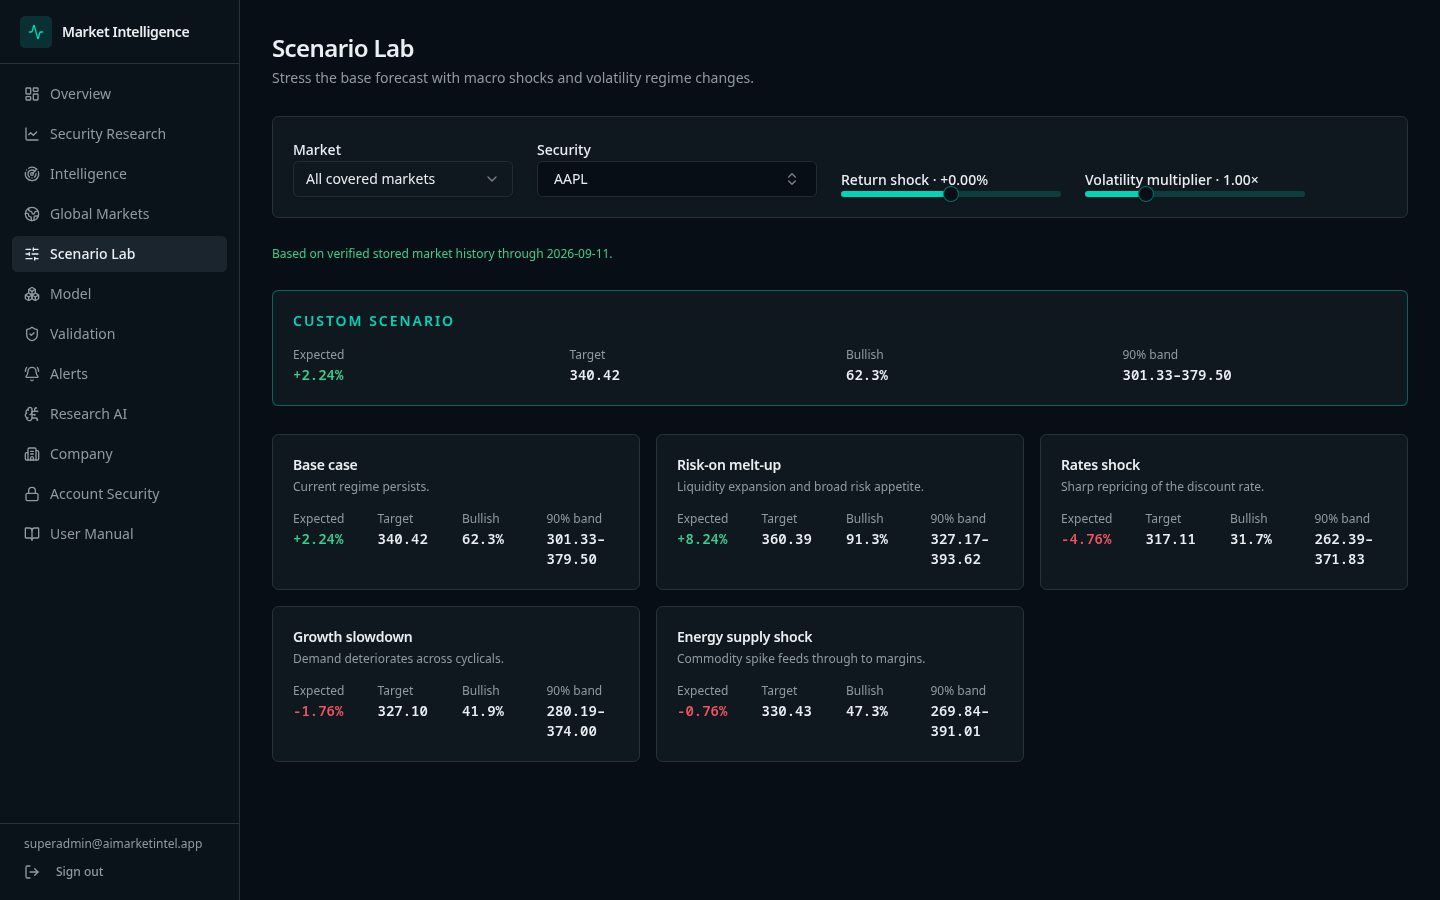
Push the base case through return shocks and volatility multipliers and compare against saved presets.
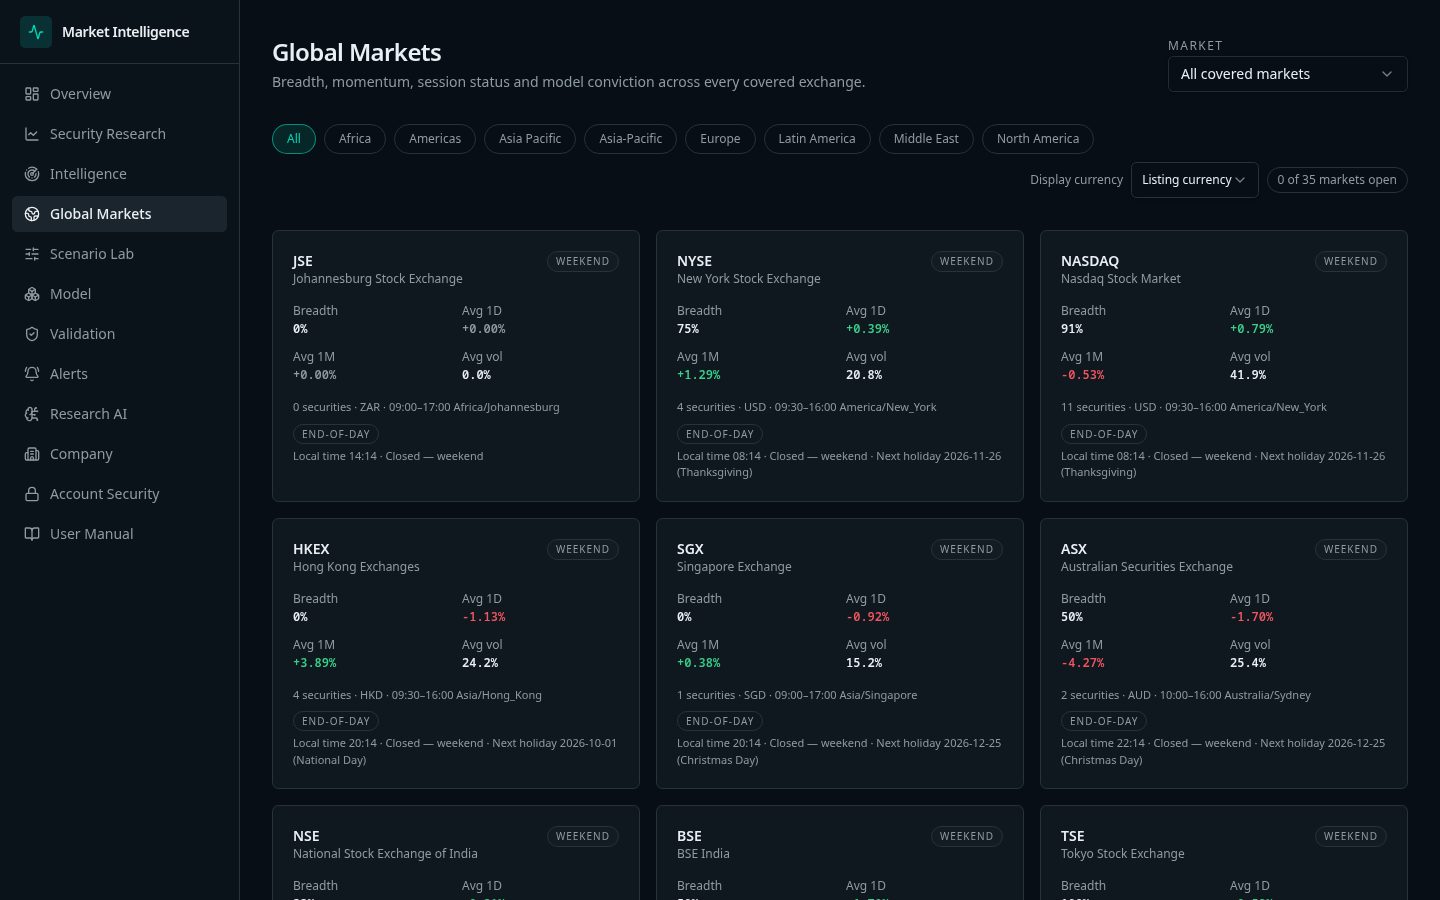
Session status, data level and stored coverage across 34 active exchanges.
Who it's for
Self-directed · Systematic · Multi-market
Understand the multi-day range, regime and catalyst history as research context.
Equity research · Fundamental · Technical · Quant
Defensible notes built on ranked drivers, fundamentals and grounded Research AI.
Portfolio · Wealth managers · Advisers · Allocation
Explain uncertainty with ranges clients understand, and stress the base case first.
Brokerage research · Client service · Risk
Client-call context and downside ranges across 34 exchanges.
Fintech · Research firms · Data platforms
Embed governed forecasts in your platform through REST API and MCP.
Stock market education & training
Teach markets as probabilities, with honest validation on real data.
Quant models vs. general AI chatbots
Large language models are excellent at explaining research, but they are not built to estimate price distributions. Stock Intelix uses quantitative models for the numbers and uses AI only to explain them — Research AI is grounded in the forecast, drivers and evidence on screen.
Forecast ranges are computed by statistical models fitted on stored daily price history for each security.
General chatbots predict the next word. Price figures they produce are text, not the output of a fitted model.
Every forecast shows a 5th–95th percentile band sized to the security's measured volatility.
Chatbot ranges tend to be narrow and can understate how far a price may fall in a stressed market.
Walk-forward hit rate and band coverage are published, so you can see how a horizon has performed.
Chatbot answers carry no out-of-sample track record and can change from one run to the next.
The same inputs give the same forecast, served from a versioned production model with provenance.
Wording and figures vary between sessions and model updates, with no audit trail.
General comparison with typical general-purpose AI chatbots; individual products vary. Forecasts are informational only and not investment advice.
A general comparison with typical tool categories. Individual products vary.
| Capability | Stock Intelix | Legacy terminals | Retail charting tools |
|---|---|---|---|
| Full probability range (5th–95th percentile), not a single target | |||
| Calibrated upside probability on every security | |||
| Published out-of-sample accuracy and band coverage | |||
| Driver attribution behind each projection | |||
| Scenario stress testing | |||
| Forecast numbers from fitted quantitative models, not chatbot text | |||
| AI assistant grounded only in the data on screen | |||
| Browser access without per-seat terminal hardware |
Scan the cross-market board for breadth, momentum and conviction by exchange.
Pull a full distribution for any security at horizons from one week to six months.
Push the base case through rate, growth and energy shocks in the Scenario Lab.
Check walk-forward accuracy and band coverage before acting on anything.
Create an account and get the full cross-market board, forecasting, scenario analysis and Research AI.
Create your account